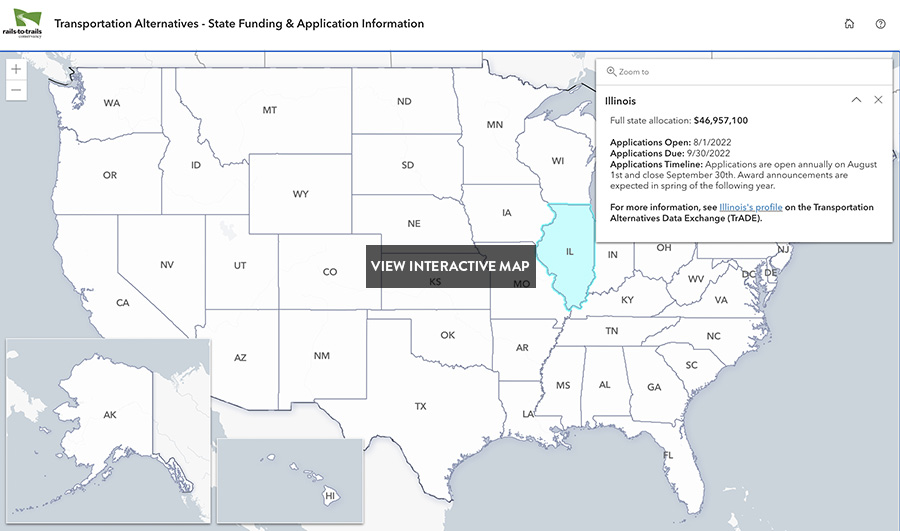
Transportation Alternatives Spending Reports
Washington, D.C.’s Metropolitan Branch Trail | Photo by India Kea
Transportation Alternatives FY25 Spending Report
In this report, we provide a look at the history of TA programs and examine how recent changes are supporting state and local decision-makers and advocates in getting eligible projects funded.
- A total of $1.39 billion was apportioned to the states for the TA program in fiscal year 2025 (FY 2025), in contrast to $1.36 billion in FY 2024.
- A total of $1.08 billion was obligated to TA projects in FY 2025, with about 4.5 times as much funding requested as obligated based upon the most recent federal data.
- The FY 2025 inter-program transfer rate (TASA funds being moved away from the TASA program and into other projects) was 6.7%, demonstrating that under IIJA, inter-program transfers have found their new level and are consistently lower than pre-IIJA inter-program transfers.
- Obligation rates were 78% of apportioned funds, down from 80% in FY 2024. This level leaves room for improvement but continues in a typical range that is well above the 61.9% rate in FY 2023, before states hit their stride in implementing IIJA reforms.
- Approximately $844 million of TE/TA/TASA funds was reimbursed in FY 2025, marking the completion of projects and the return of spent funds to local communities.
View Transportation Alternatives Spending Reports from Fiscal Year 2000 to the present. RTC has monitored how these dedicated funds since 2012.