Transportation Alternatives Spend Report FY 2024
Transportation Alternatives Spend Report FY 2024
This report was written and produced by Kim Chesser and reviewed by Kevin Mills, J.D., edited by Amy Kapp and Sharon Congdon, and designed by Joe LaCroix. Data collection and table and figure production were undertaken by Tiffany Mulally, Ph.D. Data analysis was conducted by Richard Klepner. The report was produced for TrADE at RTC.
Executive Summary
The Transportation Alternatives Set-Aside (TASA) is the largest dedicated source of funding for trails, walking and bicycling in the United States. Since 1991, this program, formerly known as Transportation Enhancements (TE), has transformed the landscape of the country. While projects in several categories (including eligibilities such as historic preservation and highway beautification) are eligible for funding from this program, the consistent leading priority in TE/Transportation Alternatives (TA) investment since the program’s inception has been the improvement of conditions for walking and bicycling. In large part due to this dedicated funding, the United States now boasts more than 42,500 miles of multiuse trails and thousands of improved street facility projects that support biking and walking. Investment in active transportation infrastructure—such as sidewalks, bike lanes and trail networks—increases mobility choices, improves safety, creates strong, connected communities, provides economic opportunities and job creation, and saves money from health benefits.
The impact of TASA has grown substantially with changes initiated by the Infrastructure Investment and Jobs Act (IIJA), passed by Congress in November 2021. In addition to increasing the funding for TASA by an average of 70% over the course of five years, this vital funding is less likely to be diverted to unrelated purposes as IIJA constrains inter-program transfers. This restricts the loopholes that over the previous decade prevented TA funding from reaching its maximum potential.
Since the inception of TE, passed in 1991, through its transformation into TA in 2012, Rails to Trails Conservancy (RTC) has monitored for more than 30 years how these funds have been invested and the projects that have been built. This annual “Transportation Alternatives Spending Report” is an important tool for states, regions and active transportation professionals to understand and strengthen the program, thus improving the efficiency and impact of the investments made.
In this report, we provide a look at the history of TA programs and examine how recent changes are supporting state and local decision-makers and advocates in getting eligible projects funded.
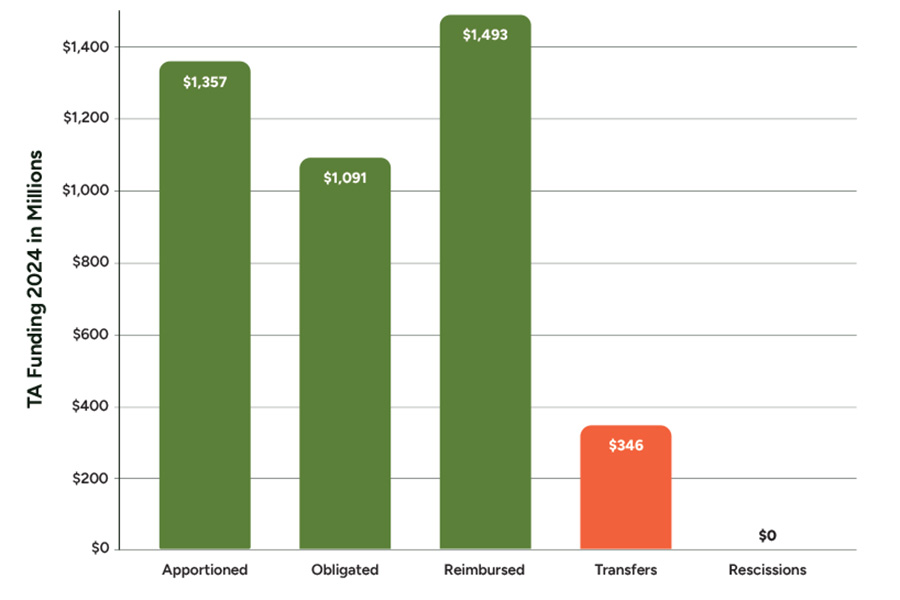
- A total of $1.36 billion was apportioned to the states for the TA program in fiscal year (FY) 2024, in contrast to $1.33 billion in FY 2023.
- A total of $1.09 billion was obligated to TA projects in FY 2024, in contrast to $4.9 billion in TA application requests in FY 2023.
- The FY 2024 inter-program transfer rate (TASA funds being moved away from the TASA program and into other projects) was 18.4% compared to 6.4% in FY 2023.
- Obligation rates were 80% of apportioned funds, up from 62% in FY 2023. This increase represents a substantial leap in program delivery now that states have hit their stride in implementing IIJA reforms.
- Approximately $1.5 billion of TE/TA/TASA funds was reimbursed in FY 2024, marking the completion of projects and the return of up-front funds to local communities.
What We Mean By Transportation Alternatives (TA)
(A Note on the Difference Between TE, TAP and TASA)
Transportation Enhancements, or TE, was the first dedicated source of federal funding for walking and biking. When Congress passed the Intermodal Surface Transportation Efficiency Act of 1991 (ISTEA), the legislation brought together roads, railroads, transit and other modes of transportation—including walking and biking—under one umbrella. Under ISTEA, Congress created TE, and ensured that funding would be available for bicycle and pedestrian transportation and for the preservation and enhancement of many of the nation’s scenic and historic assets.
The Transportation Alternatives Program, or TAP, was the next iteration of TE. The Moving Ahead for Progress in the 21st Century Act, known as MAP-21, was signed into law in 2012 with legislative language that recast many of the TE activities as Transportation Alternatives (TA). MAP-21 also consolidated the Safe Routes to School (SRTS) program and the Recreational Trails Program (RTP) to create TAP.
The Transportation Alternatives Set-Aside, or TASA, was the next iteration. The Fixing America’s Surface Transportation Act, or FAST Act, was signed into law in 2015, eliminating TAP and replacing it with a set-aside of Surface Transportation Block Grant (STBG) program funding for TA. Eligible uses for these set-aside funds include all projects and activities previously eligible under TAP.
The difference between TAP and TASA is the structure by which funds are delivered. Under TAP, the funds came through a stand-alone program, and with TASA, the funds are a set-aside of the STBG program. This was a return to prior norms. Before MAP-21, TE had been funded as a Surface Transportation Program set-aside.
In this report, Transportation Alternatives, or the acronym TA, refers to the projects within the categories of eligibility, regardless of the delivery mechanisms for these funds. TA, therefore, encompasses both the stand-alone program (TAP) of MAP-21 and the set-aside (TASA), which began with the FAST Act.
Introduction
The passage of the Infrastructure Investment and Jobs Act (IIJA) in 2021 was an important milestone for trails, walking and biking infrastructure in the United States. The legislation restores funding that will help communities across the nation accelerate the progress of the last several decades in making our country a safer place to walk and bike. Building on the solid foundation of Transportation Alternatives (TA) funding and projects—including Transportation Enhancements (TE), the Transportation Alternatives Program (TAP) and the Transportation Alternatives Set-Aside (TASA)— IIJA increases the amount of funding available in the program overall. In addition, IIJA attempts to mitigate the most problematic aspect of TASA, which has been inter-program transfers. These changes to TA restore funding and are vital to creating and completing active transportation networks while also ensuring a broader distribution in the funding and development of TA projects. This is a crucial time for states to take advantage of new opportunities for funding TA projects. See Figure 1 for details.
Figure 1: TRANSPORTATION ALT ERNATIVES KEY MILESTONES: FROM ISTEA TO IIJA
1991
Congress passed the Intermodal Surface Transportation Efficiency Act of 1991 (ISTEA). The legislation brought together roads, railroads, transit and other modes of transportation— including walking and biking—under one umbrella. Under ISTEA, Congress created Transportation Enhancements (TE) to ensure that funding would be available for bicycle and pedestrian transportation as well as for the preservation and enhancement of many of the nation’s scenic and historic assets.
2012
Two decades and three reauthorizations after ISTEA was introduced, the Moving Ahead for Progress in the 21st Century Act (MAP-21) was signed into law. The law included language that recast many of the TE activities as Transportation Alternatives (TA), and the law created the Transportation Alternatives Program (TAP) as a funding umbrella for TA, Safe Routes to School (SRTS) and the Recreational Trails Program (RTP).
There was a 30% decrease in overall funding in MAP-21. The legislation also allowed states to transfer up to 50% of their TA funding available for use across the state to other Federal-aid Highway Program (FAHP) projects, which doubled the percentage of transfers allowed under the preceding bills.
2021
After nine years under MAP-21 and its successor, the Fixing America’s Surface Transportation (FAST) Act, which largely maintained the status quo for the program, the Infrastructure Investment and Jobs Act (IIJA) was passed by Congress. This legislation provides states with a nearly 70% increase to TA on average over the next five years and a new opportunity to help meet the unprecedented demand for trails, and other walking and biking infrastructure. IIJA also limits transferability out of TA; allows states to use up to 5% of their TA funds for technical
assistance programs and program administration; and provides states with flexibility to average match requirements across the state, as opposed to requiring each project to meet the 20% federal match requirement.
Spending Analysis
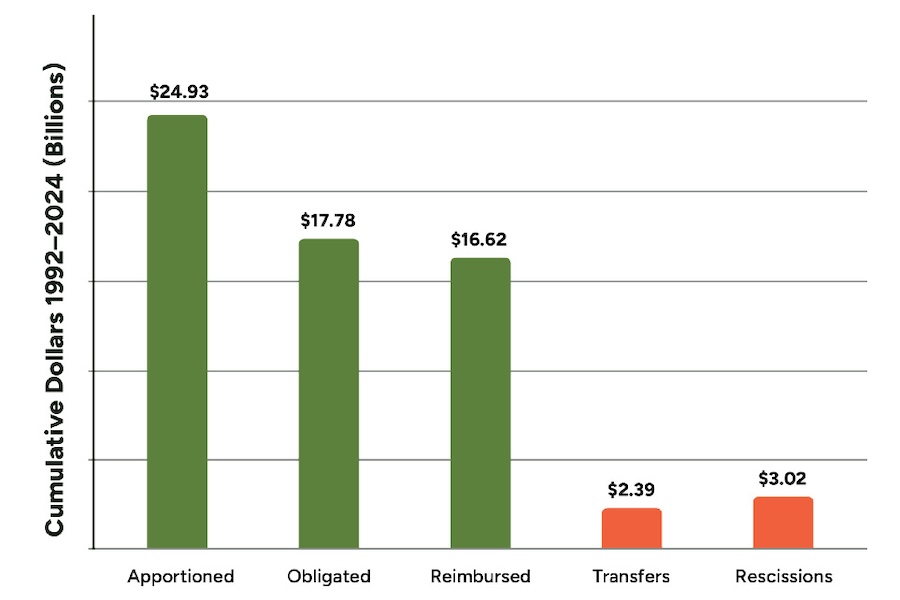
From fiscal year (FY) 1992 through FY 2024, Congress apportioned $24.93 billion to the states for TE, TAP and TASA projects, as shown in Figure 2. During that time, approximately $2.39 billion was lost to transfers and another $3.02 billion was lost to rescissions. The Transportation Alternatives Data Exchange (TrADE) national project database shows that state departments of transportation (DOTs) have programmed a cumulative total of 41,522 TE/TAP/TASA projects from FY 1992 through FY 2024. (This does not include canceled projects or projects with no federal money.) A financial summary for FY 2024 follows in Figure 3.
The federal aid project funding cycle is successfully completed when federal dollars are dispersed to the project sponsor. Both the obligation and reimbursement rates are key performance measures for project implementation. The obligations demonstrate the Federal Highway Administration’s (FHWA’s) commitment to reimburse states for the federal share of the cost of selected projects, and reimbursements are the final stage of the project funding cycle. The cumulative obligation rate for TE/TAP/TASA (FY 1992 to FY 2024) is 71.3%. The cumulative reimbursement rate for TE/TAP/ TASA (FY 1992 to FY 2024) is 67%. This means that the vast majority of obligations progress to reimbursement.
Lesson from FY 2024
FY 2024 was the third year of the IIJA implementation. States are using available remaining TAP funds from previous funding bills while concurrently using available TASA funds. Because of the increase in overall funding available through IIJA, there is substantially more funding available within TASA. This report gives an indication of how states are responding to this increase in the TA program. One thing is clear: Because of the increased funding, many states are making significant progress on the backlog of active transportation projects. To account for the increase in the overall apportionment, states have obligated funds at increased levels.
One of the most notable changes is that inter-program transfers are restricted under IIJA. For FY 2022, the FHWA prohibited such transfers and, beginning in FY 2023, transfers were limited to instances where states demonstrate to FHWA that demand for TASA-eligible projects is insufficient. After nearly a decade of a high number of transfers, this policy change in IIJA limits the use of TASA funds outside the authorizing legislation’s original intentions, which will greatly benefit trail, walking and biking projects.
During FY 2022, there was $0 in inter-program transfers due to the complete prohibition of such transfers. FY 2023 saw five states approved by FHWA for inter-program transfers, totaling $85 million. This is approximately 50% of the inter-program transfer rate from FY 2021, showing that IIJA is reducing the amount of this vital funding being diverted to unrelated purposes but does not completely restrict the loopholes that over the past decade have prevented TA funding from reaching its maximum potential. During FY 2024, 12 states were approved by FHWA for inter- program transfers totaling $250,317,066. This steep increase in transfers raises concerns that the IIJA reform is falling short of Congress’ intention to tightly limit the practice. We examine this trend in detail on pages 27 and 28.
Cumulative Impact And Unmet Demand
Over more than 30 years, the TA program has obligated more than $17.78 billion for more than 40,000 projects across the country, including creation of infrastructure for walking and biking; preservation and rehabilitation of historic transportation facilities such as rail trestles, tunnels and bridges; stormwater mitigation; and more.
Communities of all sizes and across diverse geographies are using the transformative power of these investments now more than ever. Rural communities seek more investment in active transportation projects as they plan multiuse trails and other facilities that improve economic development through recreation and tourism and create more positive health outcomes in the communities. Streetscaping invites foot traffic and enlivens main streets, creating economic opportunities for small towns.
In urban and suburban areas, there is burgeoning demand for safe streets for all users, protected bicycle lanes, multiuse pathways and trails, and other facilities that connect these communities to essential resources including food, health care, jobs and education and improve economic vitality.
Despite the increase in overall apportionment through IIJA, the available funds are not keeping up with the demand. For comparison, roughly four times the amount of allocated funds was requested through TA applications.
View the Rest of the Report
This report was written and produced by Kim Chesser and reviewed by Kevin Mills, J.D., edited by Amy Kapp and Sharon Congdon, and designed by Joe LaCroix. Data collection and table and figure production were undertaken by Tiffany Mulally, Ph.D. Data analysis was conducted by Richard Klepner. The report was produced for TrADE at RTC.
Donate
Everyone deserves access to safe ways to walk, bike, and be active outdoors.